Real Estate impacts, mortgage history & Metro DC
2. Price to income ratio - specifically, monthly payment going up faster than monthly income;
3. Rising Interest rates - may cause activity to come to a halt and prices to decline;
4. Adverse economic factors - high inflation, high short term borrowing costs, rising unemployment
Are we in a real estate bubble? The short answer is no. Our current economy has remained strong, since it has been bolstered by the federal government due to the pandemic. Unemployment is very low, the market has liquidity, and although interest rates have increased, based on historical trends, they are still considered low. Also, since 2015 there have been regulations in place to prohibit lenders from providing risky mortgage loans, which have caused problems in the past. So, in case you want the details to come to this conclusion yourself, read on.....

Why should we look at history? Well, George Santayana, a famous philosopher, once said "those who cannot remember the past are condemned to repeat it!" So, to understand where we are going, we need to understand where we have been. This presentation will provide: (a) events impacting the real estate market & home ownership; and, (b) a historical brief of the mortgage industry, since mortgage loans are crtitical for most consumers ability to buy property.
Through the "Roaring Twenties" (1920-29), the stock market grew 6-fold, as its value went from 63 to 381 in about 9 years. Even many banks risked consumer deposit funds to buy into the stock market, to make more money. This brings to mind the comment from Gordon Gecko (Michael Douglas) from the movie 'Wall Street' wherein he would say, "Greed is Good!" That comment was actually paraphrasing mega stock manager Ivan Boesky, now in jail, whom said "Greed is all right, by the way … I think greed is healthy. You can be greedy and still feel good about yourself." During this period, there was only a slight rise in home ownership, as it seemed like the stock market was where you should put any money you had. However, in September 1929, the stock market began to slide, culminating in October with the stock market crash.
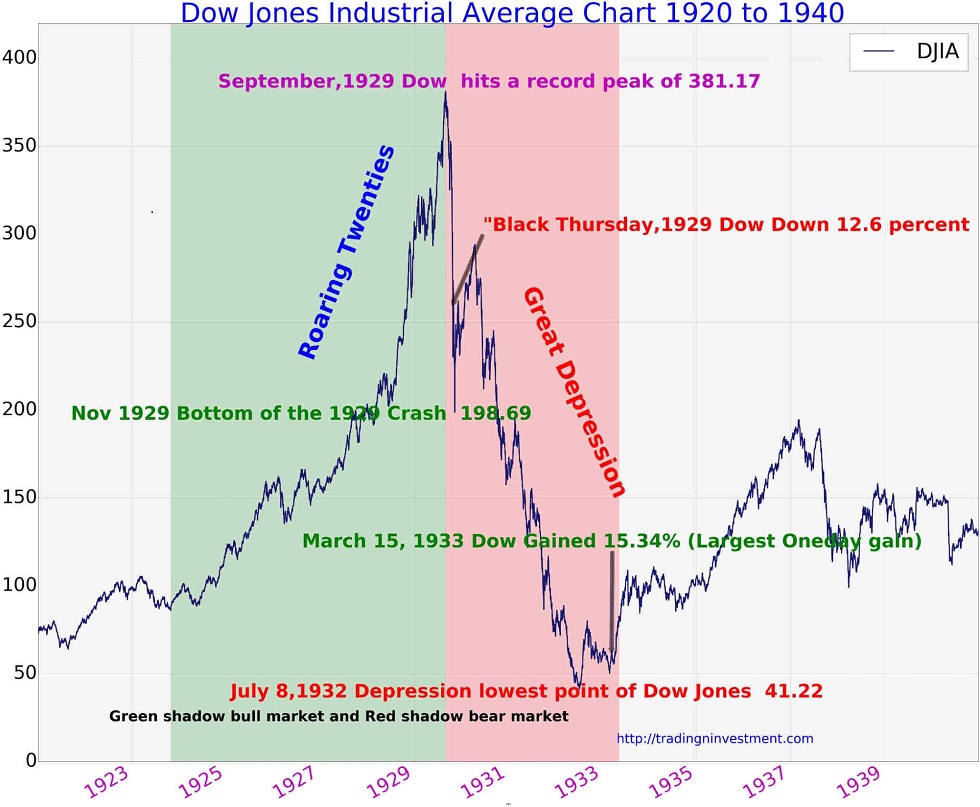
From 1929 thru 1933, the stock market lost 89% of its value, and caused a spiraling cascade of economic chaos. About half of all banks failed, particularly if they had speculated with their deposits in the stock market. The public made a run on the banks, to take out their monies, causing a liquidity crisis, and losing faith in financial institutions. Businesses began to fail, and unemployment exploded, staying above 15% from 1931 until 1940.
Since 1930's, the US has enacted legislation that made more and better loans available to the public, which increased home ownership. Below, by key year, list: % home ownership (% own), 30 year mortgage loan interest rate (% int) prevalent at the time, coupled with changes that affected positively or negatively the real estate industry:
| Year | % own | % int | Changes |
|---|---|---|---|
| 1919 | 46 | 6-8 | 30-50% down payment with a 10 year high variable interest rate loan |
| 1929 | 48 | 6-8 | Stock Market crash causes Great Depression thru 1939 |
| 1934 | 47 | 5.8 | FHA formed & offers 10% down payment loan with 20 & 30 year loans |
| 1938 | 45 | 5.2 | US government creates Fannie Mae |
| 1940 | 44 | 5.2 | Great Depression ends with manufacturing for WWII |
| 1944 | 50 | 4.3 | VA loan formed for veterans with 4% mortgage interest rate |
| 1950 | 55 | 4.4 | VA loan term extended to 30 years |
| 1954 | 58 | 5 | Fannie Mae transformed to public-private corporation |
| 1968 | 64 | 8.5 | Fair Housing Act made it unlawful to discriminate based on race or national origin |
| 1971 | 64 | 7.5 | Freddie Mac created to service secondary mortgage market |
| 1974 | 64 | 9.19 | The Equal Credit Opportunity Act made it unlawful to discriminate based on legal source of income |
| 1981 | 65 | 16.63 | Record highest mortgage interest rate of 18.63% on Oct. 9th |
| 2000 | 67 | 8.05 | Commodity Futures Modernization Act |
| 2015 | 63.5 | 3.85 | Dodd-Frank Wall Street Reform and Consumer Protection Act |
| 2016 | 63 | 3.65 | Post 2008-10 housing crisis low point of home ownership |
| 2020 | 67 | 3.11 | December lowest ever mortgage interest rate (2.68%) since recorded |
Besides learning the changes to the mortgage markets, we need to understand what happened in the general lending environment as it will eventually affect the mortgage market and interest rates. Beginning in December 1965, the US government began to raise the Federal Funds Rate (FFR) above 4.125%, gradually until it reached over 10% in 1969, then 13% in 1974, and surpassing 20% in 1981. The FFR is the interest rate at which depository institutions (banks and credit unions) lend reserve balances to other depository institutions overnight, on an uncollateralized basis. Commercial banks borrow from the Federal Reserve System primarily to meet reserve requirements before the end of the business day when their cash on hand is low. Since the cost to borrow short term money was increasing consistently for so many years, banks were forced to increase the interest they charge their commercial clients on long term loans. This had the compound effect of increasing costs of goods sold, causing what we now call 'spiraling inflation'.
The 1973 oil embargo caused a barrel of oil to increase in price from $21 in July 1973 to $57 in Jan 1974, and up to $128 by April 1980. This caused gasoline prices to rise, and subsequently all transported goods to increase in price, as well as petroleum based products (e.g., plastic). So, increasing the cost to borrow funds, increased cost of raw materials & increased energy costs, caused inflation to rise until it reached 10.3% in 1980.
By October 1981, these impacts, coupled by the increased risk of a mortgage, skyrocketed the mortgage interest rate to 18%. Besides having adverse effects in the housing market, the high inflation and cost to borrow caused dire impacts to the US economy as businesses shut down, and many people were left without jobs. In contrast to that situation, those that were not as impacted by these economic issues, saw the expanded use of revolving credit cards with consumers then more focused on the present than the future. Ironically, the increased debt caused by credit cards helped the economy move forward.
Since the 1990's, inflation has been ranging mostly between 2-4%, which has made it much easier for the government to plan and the public to live. The inflation stability during the 90's helped mortgage interest rates to go under 6%. Lower interest rates coupled with loosening lending standards caused purchase demand to increase, which caused prices to climb, particularly between 2000-2005.
In 2000, the Commodity Futures Modernization Act (CFMA) was passed by congress and provided legal certainty for swap agreements, aka Derivatives, without any regulation or oversight. This enabled/promoted risk taking with impunity. Lenders then began offering risky loans, repackaged those loans into bonds labeling them as AAA risk rated, and selling them to investors, whom were unaware how much risk they carried.
In 2006, the "Housing Bubble" began to come to a head, when real estate sale prices began to slide. This culminated in October 2008 with the liquidity crisis in the financial markets, which caused lenders to stop all lending activity. The lack of borrowing capability had business sectors slow, or come to a complete halt, caused increased unemployment which resulted in an increase of mortgage defaults, and subsequent rapid increase in foreclosures.
In 2008, the federal government moved aggressively to shore up the financial sectors, at a very high cost, and stopped the situation from getting worse. It took many years for business sectors to recover such that employment grew and economic activity picked up.
In 2011, a congressional report on the 'Anatomy of a Financial Collapse' resulted with key recommendations to avoid this event from occurring: (1) Regulate Structured Finance Transactions; (2) Narrow Proprietary Trading Exceptions; (3) Design Strong Conflict of Interest Prohibitions; and, (4) Study Bank Use of Structured Finance.
In 2015, the passage of the Dodd-Frank Wall Street Reform and Consumer Protection Act included regulation on Structured Finance Transactions (Swap agreements, Derivatives, CDO's, CDS, etc.), which many believe was the principal reason that high interest rate subprime loans were offered, which was a key cause of the 2008 financial crisis, and the main reason behind the 2008-2010 housing crisis. This legislation divided regulatory authority over swap agreements between the CFTC and SEC, so as to avoid this same thing from ever happening again.
So, what are the key learnings that we can glean from the past?1. Regulation will limit the financial sector's ability to speculate, hence, reduces the possibility to expand risky loans
2. Federal oversight is needed to assure that the financial sector is kept in check
3. Financial stability is needed so as to expand business, keeping unemployment and inflation in check, for a prosperous housing market
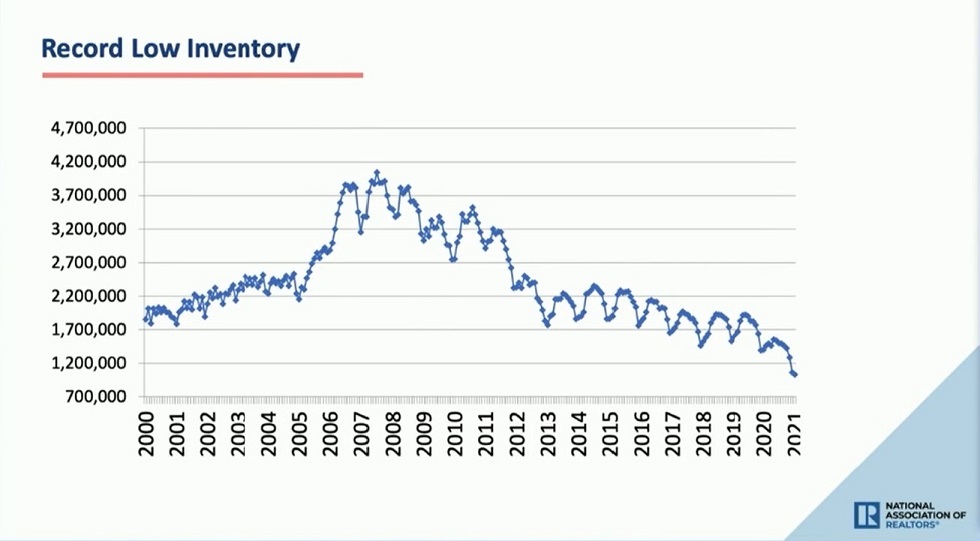
In 2020, we saw interest rates reduced, as a response to the pandemic, so as to foster economic activity. Real estate buyers came out to buy realizing that they could buy much more house with the same monthly payment, and this was an opportunity they may never again see. As rates dropped, sales increased dramatically, but many sellers held off from selling, which caused available properties for sale (inventory) to continue the downward slide, which continued in 2021.
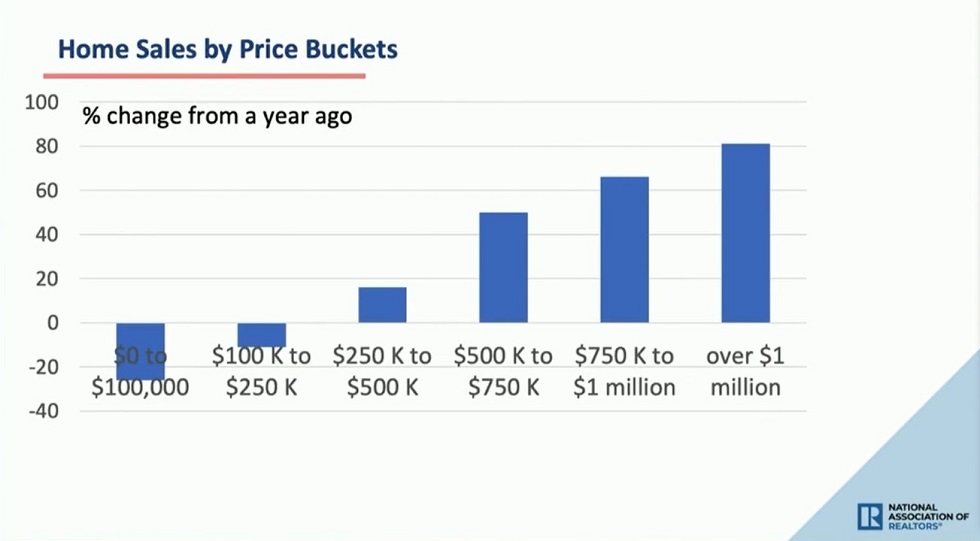
When looking at early 2021 inventory by price, this impact is much more pronounced the lower the price a property is sold. This was a clear indication that many first time buyers realized it was time to buy and own their property.
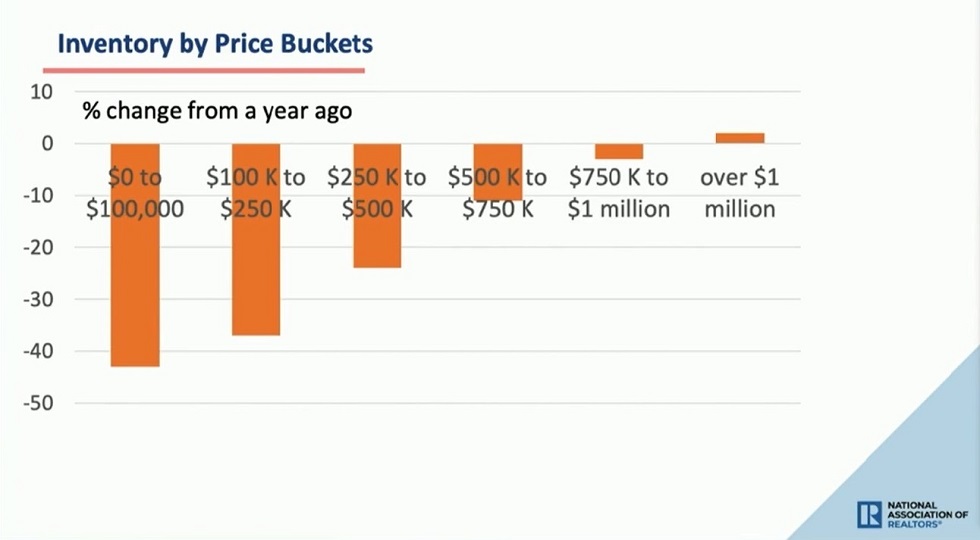
This constraint was felt as the lower in price you went, there were proportionally fewer properties available. Hence, the market sales skewed to higher priced properties, causing the median home price to increase far ahead of the actual prices, due to the change in mix. This has caused many buyers to get into a frenzy as they believe properties are more expensive than they actually are. Buyers then start looking to buy more expensive properties, they bid up the market, and in the process, it becomes a self-fulfilling prophecy.
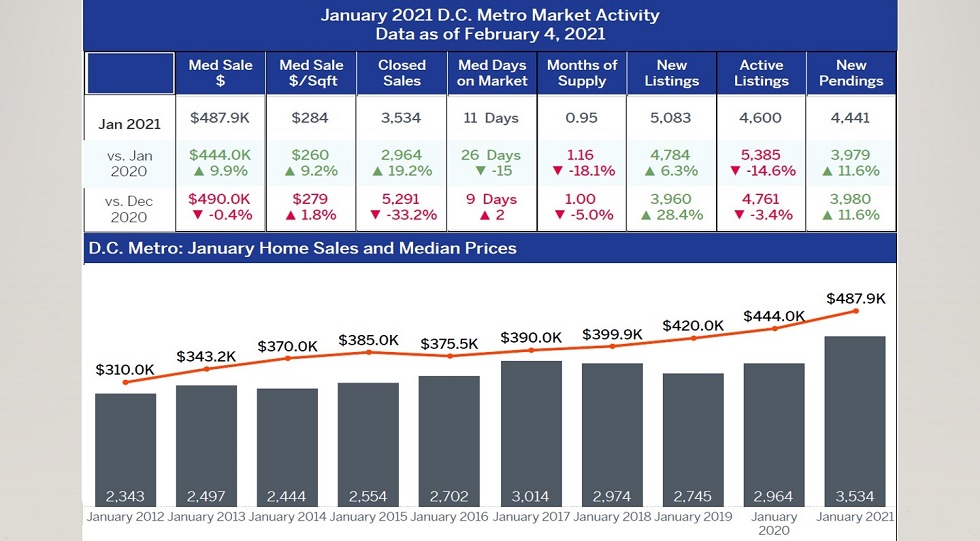
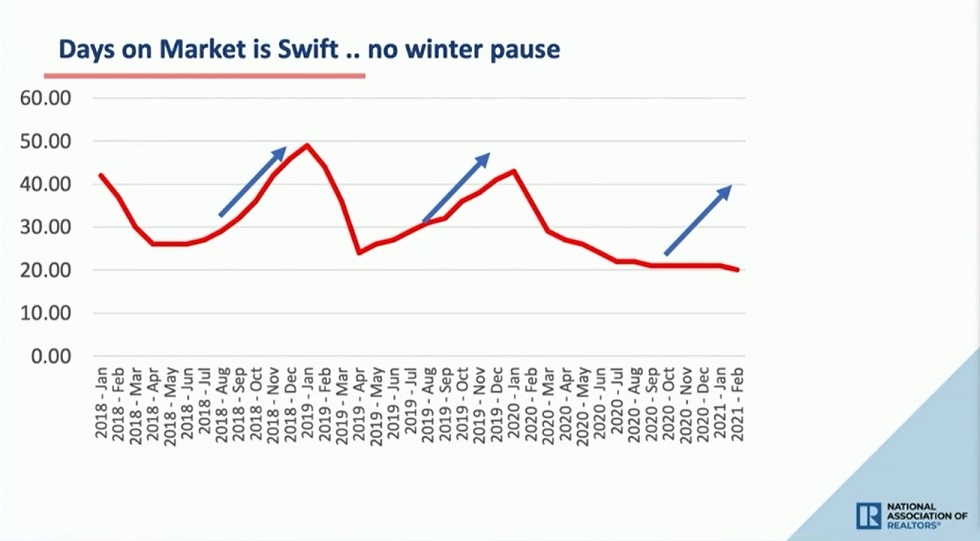
This frenzy becomes exacerbated by the desire to move quickly to buy the home before another does and properties begin to sell ever more quickly. This causes the 'Days On Market' (DOM), the time between going on the market as active and going under contract, to drop. Note that during Winter of this year DOM was about 20 days versus 40 days for prior year. This means that properties are selling twice as fast this year than last year, before the pandemic!
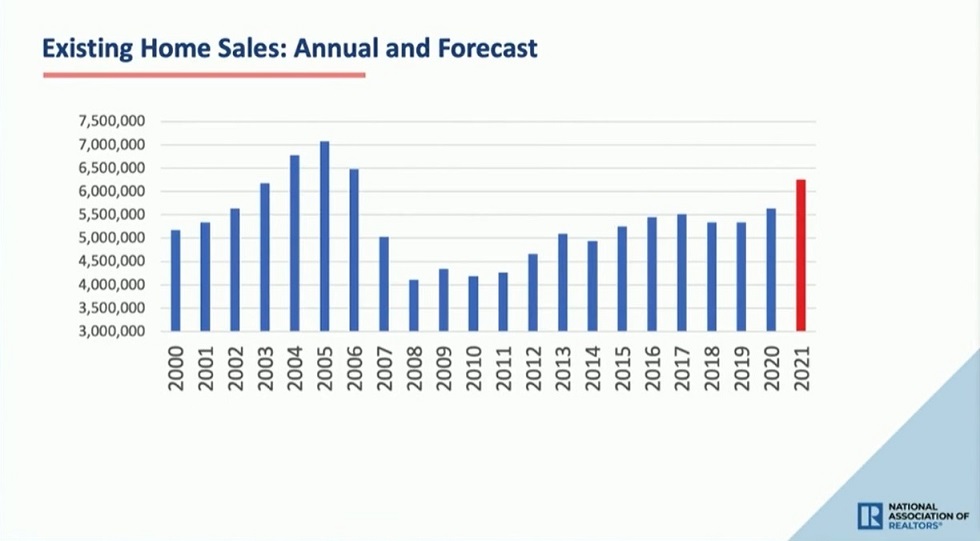
What does this mean nationally? Well due to a significant increase in new construction, coupled with the public becoming more adapted to working within the pandemic, the volume of property sold is expected to increased more than 10% versus prior year.
So, what will keep the real estate market moving forward? The current trend should continue and we expect it to do so as long as it is fueled by the following: (1) pandemic continues to be staved off by growing public vaccination; (2) mortgage interest rates remaining in historically low range, increasing gradually; (3) continued economic expansion, which had been assisted markedly by the government subsidies to business and the public through various programs; (4) the crux is the ability of the federal government to bring inflation into a more acceptable range inflation forecast. As inflation reduces, and buying power increases, this will have a positive impact on consumer sentiment, which will keep us on a virtuous circle.
So, what are we seeing and expecting for the Metro DC market? The numbers tell a clear story, that the same thing is happening here, yet sales are occurring faster than the national average with proportionally less property being available for sale. This has caused bidding wars on properties, where average sales prices have increased 10%.